We love our phones.
More specifically, we love smartphones. And why wouldn’t we? They’re no longer just a compact communication device. Smartphones are now high-quality cameras and entertainment devices that also support learning, productivity, communication, and so much more.
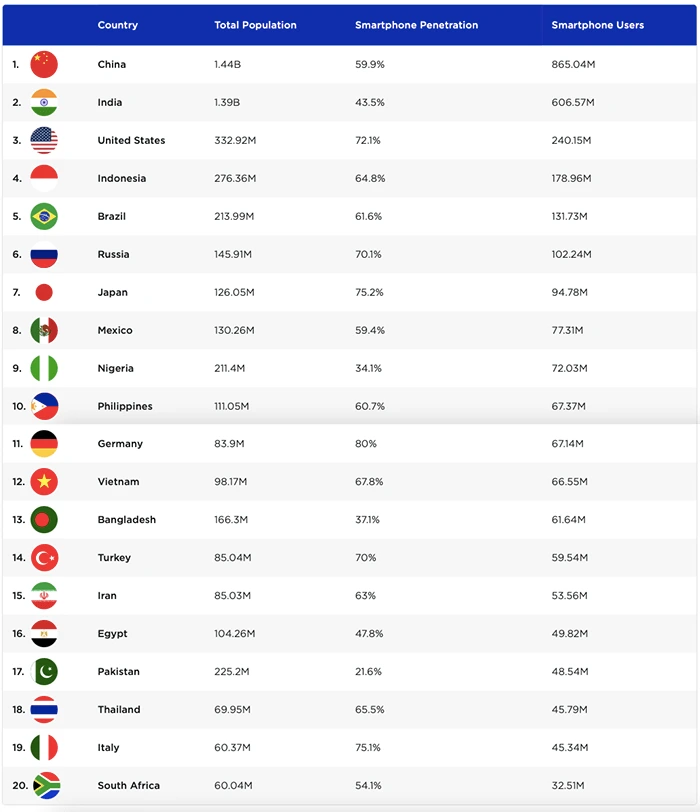
Smartphone ownership has nearly doubled in the last six years, growing from 3.668 billion in 2016 to 6.567 billion (estimated) in 2022. Of course, ownership isn’t equally distributed. Smartphone penetration in the US is at more than 70 percent of the population. But in other countries, it can be lower than 40 percent.
Why does this matter?
Whether you’re a seasoned or novice app developer, you need to have some knowledge of the market. Particularly if your app is targeting specific geographical regions. Using nandbox to develop your own native app will make the process less complicated. But you still need to know your market.
But knowing how many people own a smartphone isn’t the only statistic that can be of benefit. Which is why we have compiled this summary of interesting—and useful—mobile app statistics on download and usage habits.
Essential Mobile App Statistics
In 2021 there were a little more than 2 million apps on the Apple App Store and 3.5 million apps on Google Play. By the third quarter of 2022 the number of apps in the Apple App Store had dropped to 1.6 million. Google Play showed a growth in the number of apps, adding another 500,000 to the 2021 figure.
Since 2018 Apple has become stricter with their review guidelines, which led to them removing spam, clone, and abandoned apps. This accounts for some of the drop in the number of apps available on the App Store.
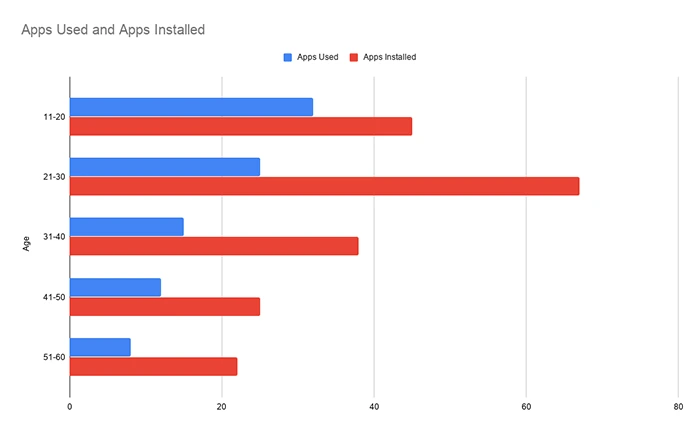
The average smartphone user has 40 apps installed on their device. However, 89 percent of the usage time is spent on only 18 apps. Young adults spend the most amount of time using apps, an average of 112 hours a month. Users aged 65 and older only average 51 hours a month.

The activity most users report engaging in on their smartphones is chatting and messaging, followed by sending emails.
By 2025, global revenue from mobile apps is expected to nearly double the $318-billion generated in 2020.
Mobile App Download Statistics
The shrinking of the Apple App Store shouldn’t make you cautious about creating your own mobile app. The app ecosystem is very healthy, showing continuous growth in annual app downloads. Since 2016, app downloads are up 64 percent, reaching 230 billion in 2021.

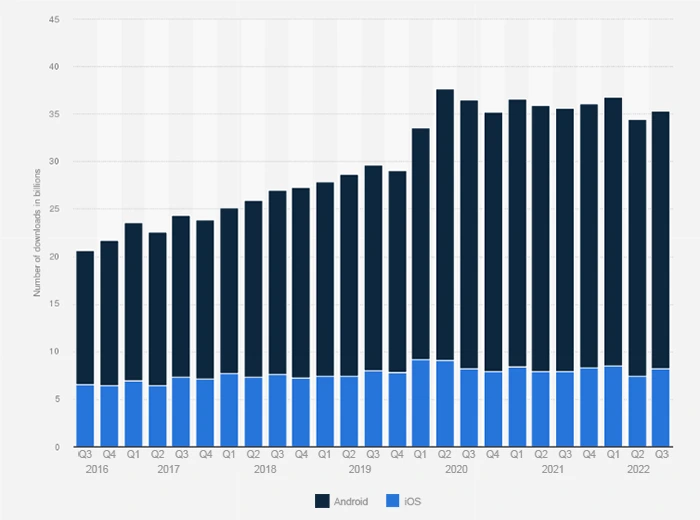
The bulk of those downloads—and growth‑come from Google Play. But downloads from the Apple App Store have remained consistent, averaging close to 8 billion downloads per quarter.
Free Apps & Paid Apps Statistics
If the app you’ve just built is meant to support your business, then it should be available free of charge. But for all other types of mobile apps, you want to consider how you can monetize it. The most popular methods for monetizing apps are:
- To charge a once-off fee for the app. With this option, you also need to consider if you are going to charge for major updates too.
- To display ads in the app. Here you could also decide to offer a freemium upgrade with users paying a once-off fee to remove the ads.
- Charging a subscription fee. Users can download the app and access basic features for free. But to access premium features requires a monthly, quarterly, or annual subscription.
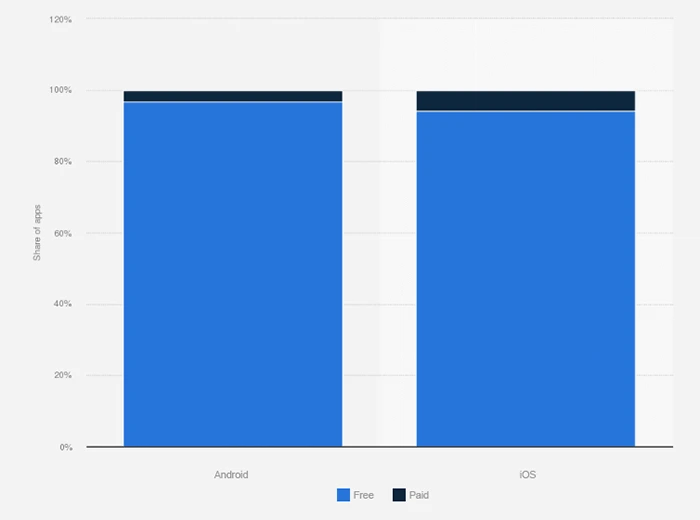
This results in somewhat skewed statistics when looking at free versus paid apps. More than 90 percent of apps are free in both the App Store and Google Play. Apps that allow in-app purchases are still shown as free apps if there is no upfront fee to download them.

When it comes to app revenue, Apple’s App Store outperforms Google Play. Total app revenue for both operating systems was $133-billion 2021, but $85 billion of that was for iOS alone.
67 percent of total app revenue in 2021 was from games, and subscription revenues amounted to $15 billion. Again, iOS took the lion’s share, with Google Play only responsible for 22 percent of subscription revenues.
Popular App Categories
Knowing which app categories are most popular is useful if you’re an entrepreneurial app developer. There might still be some value if you’re developing an app to support your existing business, but not much. Popular app categories give you an idea of the type of apps that are most in demand. But these categories also tend to be highly competitive, so your app is going to be less visible.

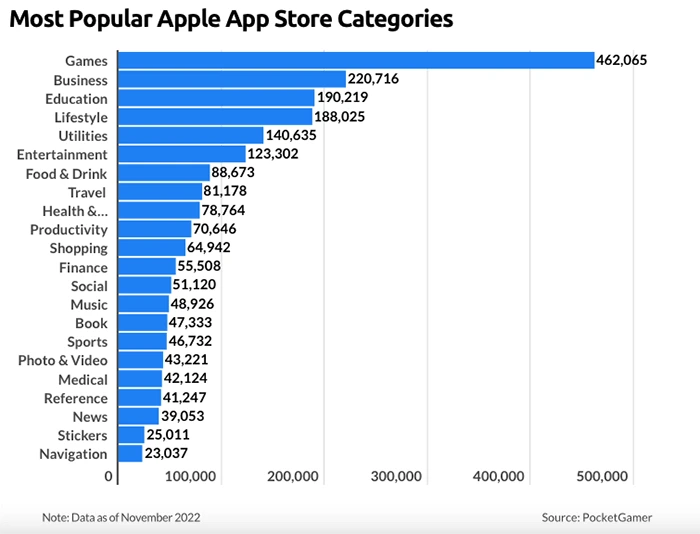
Mobile games account for more than half of app store revenue. So, it shouldn’t be surprising that games is the top category on both the App Store and Google Play. Just under 13 percent of the apps on the App Store are games, and on Google Play it is 13.8 percent. Second and third place go to business and education apps on the App Store. On Google Play the reverse is true, with education apps outnumbering business apps.

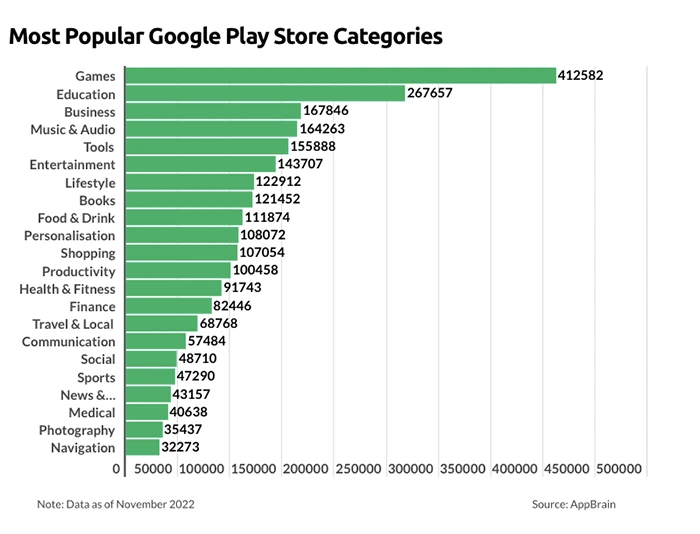
From there, the popular categories on the App Store can differ significantly from that of Google Play.
Most Downloaded Apps
Globally—and by country—the most downloaded apps tend to be social and communication apps for both iOS and Android.

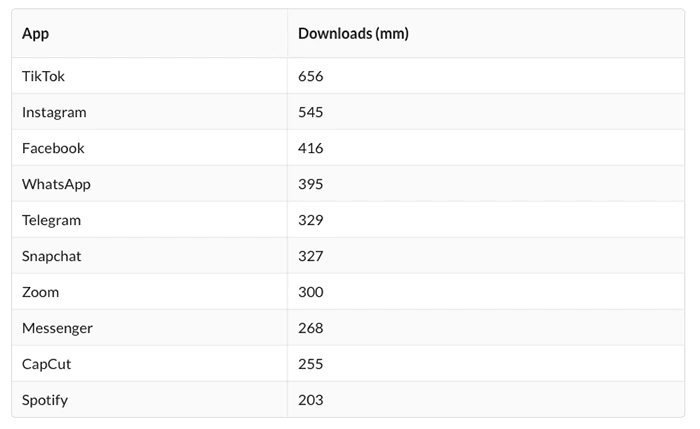
It is only when looking at the most downloaded apps by country that you start to see other apps featured too. Still, large e-commerce apps, cash payment apps, and popular entertainment apps are overrepresented in the top 10.
As an app developer, you should look at the top 100 apps in your country and globally. It is a great way to discover app layouts and features that seem to appeal to users.
Mobile App Usage Statistics
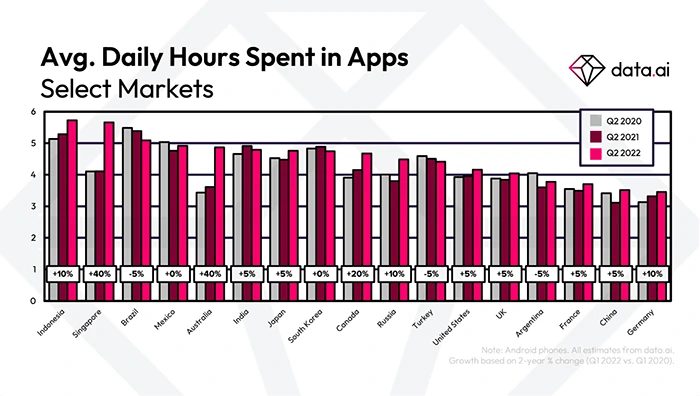
The COVID-19 pandemic impacted how much time we spend on our phones, and more specifically, in apps. Several countries have recorded a 10, 20, and 40 percent increase in average daily hours spent in apps in Q1 2022. In 13 of 17 countries measured, the daily average is now above four hours, and above five hours in three.

RescueTime analyzed their user data in 2019 and found that:
- We check our phones 58 times a day on average.
- We rarely go longer than 1 hour and 43 minutes without touching our phones.
Time Spent by App Type
Naturally, we aren’t spending all our time in a single app. But time spent in apps is also not equally distributed across all types of apps. Social, gaming, and communication apps get the most use, followed by entertainment and music.

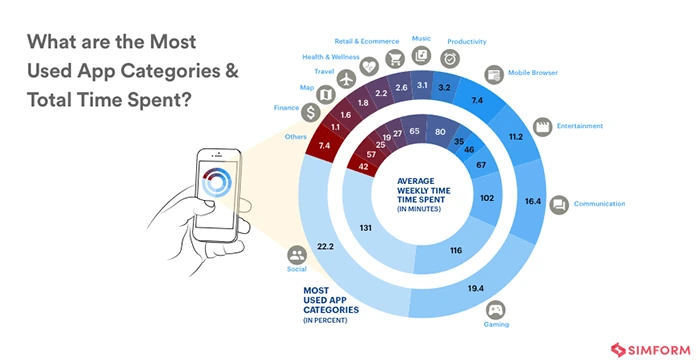
Users only open retail & e-commerce, travel, maps, and finance apps when necessary. However, users still spend quite a few minutes using e-commerce and finance apps. This is likely due to the transactional and decision-making nature of these apps.
App User Retention Statistics

An app is not successful simply because it is downloaded and installed by millions of users. An app needs to retain a healthy portion of users who originally installed it. And these users need to use the app on a regular basis. User retention after 30 days is a key metric app developers need to measure. Along with how frequently users open an app and how much time they spend using the app.
The average retention rates across 31 different app categories are:
- Day 1 – 25.3 percent
- Day 30 – 5.7 percent

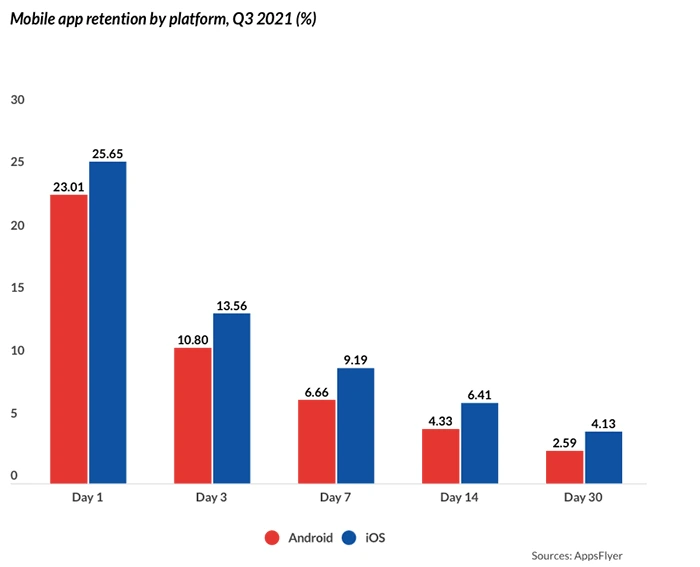
The average Day 30 retention rate on iOS is 4.13 percent. On Android it is 2.59 percent. A low retention rate suggests users find no value in an app. And it is an opportunity for an app developer to improve their app.

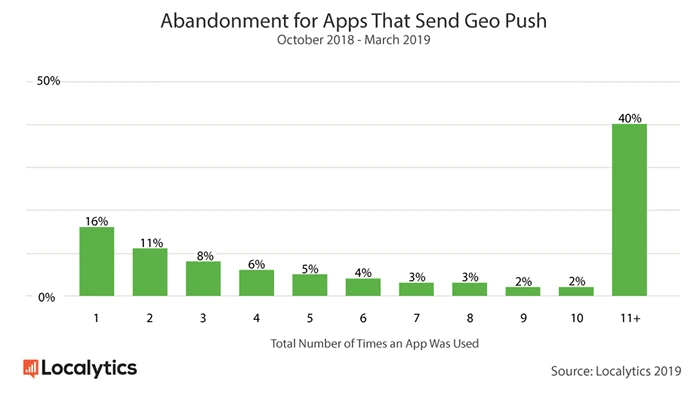
Research also suggests that location-based and in-app messaging boost retention and usage rates.
Generational Screen Time Habits
More than 50 percent of each generation say they’re on their phone more than they would like to be. Gen Z users report the highest monthly hours spent on apps. But most Gen Z users also claim to spend too much time on their phones.
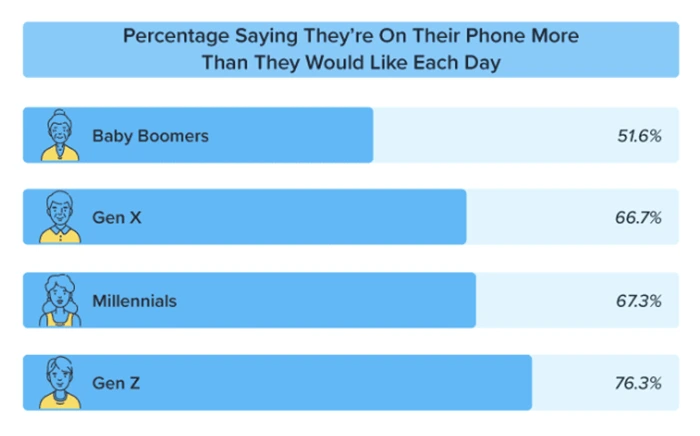

All generations also report taking steps to reduce screen time. But less than 40 percent of Millennials and Baby Boomers are doing this.
Now you know which phone operating systems and app categories are most popular. And you also have a better idea of how much time people spend on their phones and in apps. All that is left for you is to combine this info with your brilliant app idea. And then use nandbox to create your app in minutes, for either Android phones, iPhones, or both.