How well do you truly understand your customers’ interactions with your brand? What are the results of them browsing the website, engaging with social media posts, making a purchase, or seeking customer support? For digital marketers and small business owners, grasping these interactions isn’t just important — it’s a must-have. To make data-based decisions, businesses need to know what customers want. That’s where customer experience analytics come in.
What is Customer Experience Analytics?
At its core, customer experience analytics is about the way customers interact with a business. It helps understand what makes customers tick and then, after the analytics part, tailor their experience to be more enjoyable and personalized.
Imagine you’ve developed a mobile fitness app. By analyzing user reviews, app usage patterns, and feedback through in-app surveys, you notice that many users are frustrated with long loading times between workout sessions. With this insight, you can optimize the app’s performance to improve the user experience, leading to higher retention rates and positive reviews.
What are the Key Benefits of Customer Experience Analytics?
The real value of customer experience analytics is uncovered if we take the main benefits business can get from it.
Improving Customer Retention
When the business knows exactly what makes customers stay or leave, you can devise strategies to keep them loyal to your brand – as proved by Harvard Business Review. Their research shows how increasing customer retention by just 5% can boost profits by 25% to 95%.
For example, imagine you run a subscription box service and discover that customers often cancel due to delayed deliveries. To get boost to retention rates, the business needs to tackle this issue head-on, and by improving your delivery times, you can significantly improve customer experience and retention rates.
Enhancing Personalization and Customer Satisfaction
According to Epsilon, 80% of consumers are likelier to do business with a company if it offers personalized experiences, which is obvious but often forgotten by businesses.
Let’s take two examples:
- An e-commerce platform can use purchase history data to offer tailored product recommendations, significantly boosting customer satisfaction.
- A streaming service could use viewing habits to recommend shows and movies, making users feel like it understands their tastes.
When diving into customer experience analytics, you can turn these insights into tangible actions that genuinely connect with customers, building loyalty and increasing their lifetime value. This personalization leads to happier customers who stick around and engage more with your brand.
Driving Informed Decision-Making
Companies that take on customer analytics are 23 times more likely to outperform their competitors in terms of new customer acquisition, according to research by McKinsey & Company.
Customer experience analytics tools are invaluable for making data-driven decisions. A mobile app developer might use customer feedback and usage analytics to prioritize feature updates and ensure the app effectively meets user needs.
Essential Metrics to Track in Customer Experience Analytics
Which metrics should you focus on to get the most comprehensive view of your customer experience? In total, there are four main metrics to keep track of.
Customer Satisfaction Score (CSAT)
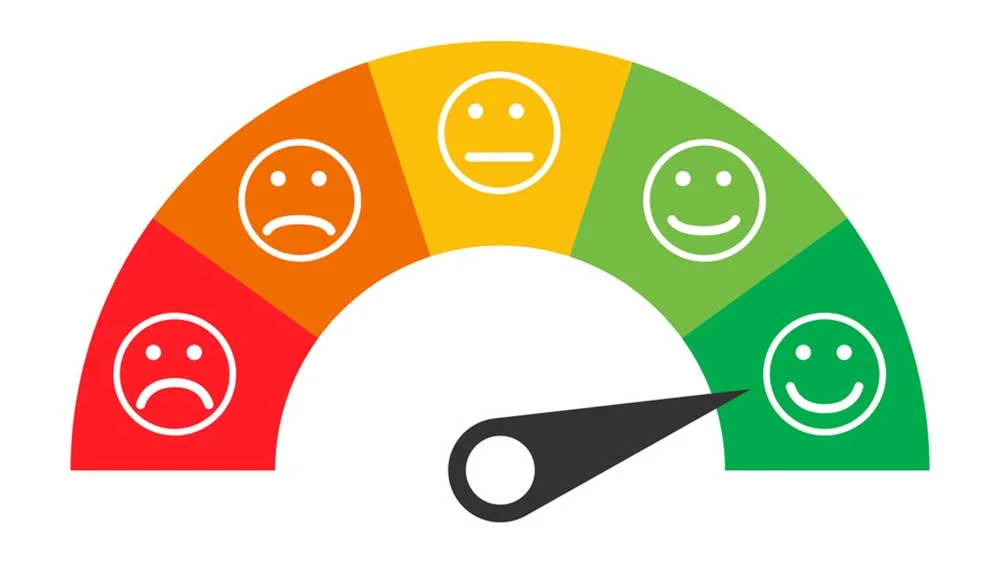
One of the most straightforward metrics for measuring customer satisfaction is the Customer Satisfaction Score (CSAT) you can get after a simple survey of your product’s users.
Ask people to rate their overall satisfaction with your product or service on a scale of 1 to 5 or 1 to 10 and then count the CSAT:
For example, if 80 out of 100 customers rated their satisfaction as 4 or 5, your CSAT would be 80%. A higher CSAT indicates that your customers are generally pleased. And this, in turn, means that there are brand advocates and supporters of the business.
Net Promoter Score (NPS)
The Net Promoter Score (NPS) shows the level of loyalty. To get NPS, customers should answer how likely they are to recommend your business to others on a scale of 0 to 10.
Then, count the NPS according to the formula (mind that promoters are customers who give a score of 9-10, passive are customers who give a score of 7-8, and detractors are customers who give a score of 0-6): For example, if 60% of your customers are promoters and 20% are detractors, your NPS would be 40.
Customer Effort Score (CES)
The Customer Effort Score (CES) shows how easy it is for customers to interact with your business. Typically, CES is collected by asking customers to rate the ease of their experience on a scale of 1 to 5 or 1 to 7.
After all the answers are gathered, the formula to count them is simple:
For example, if you have a total of 500 effort ratings with a sum of 2000 and you asked 100 customers, your CES would be 4. A lower effort score indicates a frictionless customer experience, which can lead to higher satisfaction and loyalty.
Customer Lifetime Value (CLV)
Customer Lifetime Value (CLV) measures the total revenue a business can expect from a single customer over their lifetime. This is one of the most popular metrics to keep track of.
To count CLV, you need to gather the average purchase value, average purchase frequency, and customer lifespan and then follow the formula:
For example, if your average purchase value is $50, the purchase frequency is 4 times a year, and the average customer lifespan is 5 years, then your CLV would be 50 \times 4 \times 5 = \1000 $.
How to Implement Customer Experience Analytics
To earn the first benefit out of customer experience data analytics, businesses can concentrate on three steps.
-
Set Clear Goals and Metrics
Whether looking to improve customer experience and satisfaction, increase retention, or grow sales, objectives will help you zero in on the most relevant data.
If your goal is to improve customer satisfaction, you might track metrics like CSAT and NPS. Clear objectives provide a roadmap for your analytics journey.
-
Choose the Right Tools and Platforms
There are many and many customer experience analytics tools available that can help you collect, analyze, and interpret data. More tools appear almost every week, but there is a hall of fame, a list of tools that are reliable and popular for analytics:
- Google Analytics: Choice for tracking website performance, user behavior, and conversion rates
- HubSpot: A comprehensive inbound marketing, sales, and service platform that helps you track customer interactions across multiple channels, from email campaigns to social media
- Tableau: A data visualization tool that helps interpret and present data in an easy-to-understand format
- Coupler.io: All-in-one data analytics and reporting platform. It provides a gallery of ready-to-use templates for sales and web analytics, CRM tracking, and more. For instance, you can find a sales weekly report template and monitor sales performance effortlessly
- Zendesk: Ideal for customer support, it provides analytics on customer interactions.
- Salesforce: Shines insights into customer data, sales trends, and marketing campaign effectiveness
- Medallia: Specializes in customer experience management, collects feedback from various touchpoints, and provides actionable insights
-
Use Data to Create Actionable Insights
Collecting and visualizing data is an important step, but what’s next? The great value lies in turning that data into actionable insights that can drive meaningful improvements.
Here’s how to make the most of your customer experience analytics:
- Analyze trends and patterns: Look for recurring themes or behaviors in your data. Do you notice a particular point in the customer journey where satisfaction dips?
- Identify areas for improvement: Pinpoint specific areas that need attention. Is there a common complaint or issue that keeps popping up?
- Implement changes based on your insights: Use the insights gathered to make strategic changes.
For example: If your CSAT scores are low, you might discover that customers are unhappy with long wait times for support. To deal with this, you could:
- Add more support staff during peak times;
- Implement a chatbot to handle simpler queries quickly;
- Review and optimize your current support processes to reduce response times.
When breaking down the data and zeroing in on specific issues, you can create targeted strategies that will enhance customer satisfaction and loyalty.
Wrapping Up
So, answering the question of “What is customer experience analytics?”, it’s not a buzzword. It’s a crucial aspect of modern business strategy that can significantly improve customer satisfaction, retention, and overall business performance.
If s business focuses on essential metrics and leveraging the right tools, digital marketers and small business owners can create a more engaging and profitable customer experience.


